开始
- 下载并安装构建
1 | curl -s https://api.github.com/repos/prometheus/mysqld_exporter/releases/latest | grep browser_download_url | grep linux-amd64 | cut -d '"' -f 4 | wget -qi - |
- 验证
1 | ./mysqld_exporter --version |
- 增加mysql配置
1 | groupadd --system prometheus |
- 修改mysql关于prometheus权限
1 | CREATE USER 'exporter'@'localhost' IDENTIFIED BY 'XXXXXXXX' WITH MAX_USER_CONNECTIONS 3; |
- 增加启动脚本(内容自己调整)
1 | cat /etc/systemd/system/mysql_exporter.service |
- 启动
1 | systemctl enable mysql_exporter |
测试
1
curl localhost:9104/metrics
配置prometheus job
1 | - job_name: 'my_mysql_exporter' |
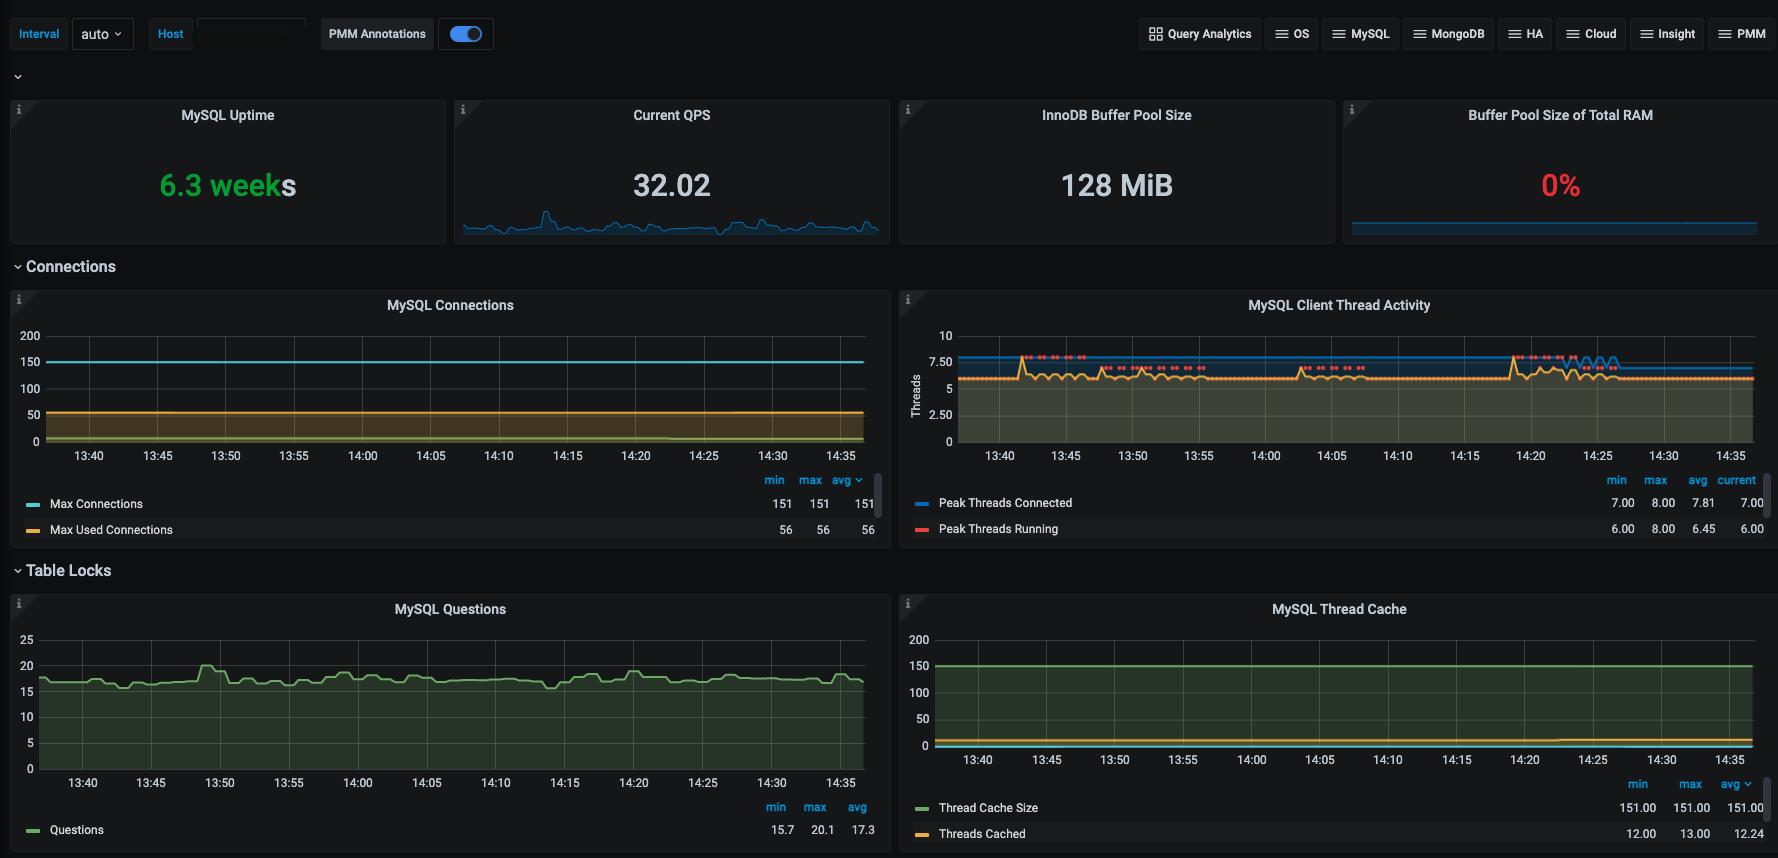
配置grafana
导入grafana之后,效果如下: