自建redis监控方案

开始

  • 下载并安装构建
1
2
3
$ git clone https://github.com/oliver006/redis_exporter.git
$ cd redis_exporter/
$ go build .
  • 验证
1
2
$ ./redis_exporter --version
INFO[0000] Redis Metrics Exporter <<< filled in by build >>> build date: <<< filled in by build >>> sha1: <<< filled in by build >>> Go: go1.13.8 GOOS: linux GOARCH: amd64
  • 增加启动脚本(内容自己调整)
1
2
3
4
5
6
7
8
9
10
# cat /etc/systemd/system/redis_exporter.service
[Unit]
Description=redis_exporter
After=network.target
[Service]
Type=simple
ExecStart=/www/monitor/redis_exporter/redis_exporter -redis.addr 127.0.0.1:6379 -redis.password ****** -web.listen-address 0.0.0.0:9121
Restart=on-failure
[Install]
WantedBy=multi-user.target
  • 启动
1
2
3
$ systemctl enable redis_exporter.service
$ systemctl start redis_exporter.service
$ systemctl status redis_exporter.service
  • 测试

    1
    $ curl localhost:9121/metrics

    配置prometheus job


1
2
3
4
5
6
7
8
9
10
- job_name: 'my_redis_exporter'
scrape_interval: 60s
scrape_timeout: 60s
metrics_path: '/metrics'
scheme: http
static_configs:
- targets:
- '172.16.5.89:9121'
labels:
instance: 'my_redis'

配置grafana

直接用这个dashboard:点击我跳转
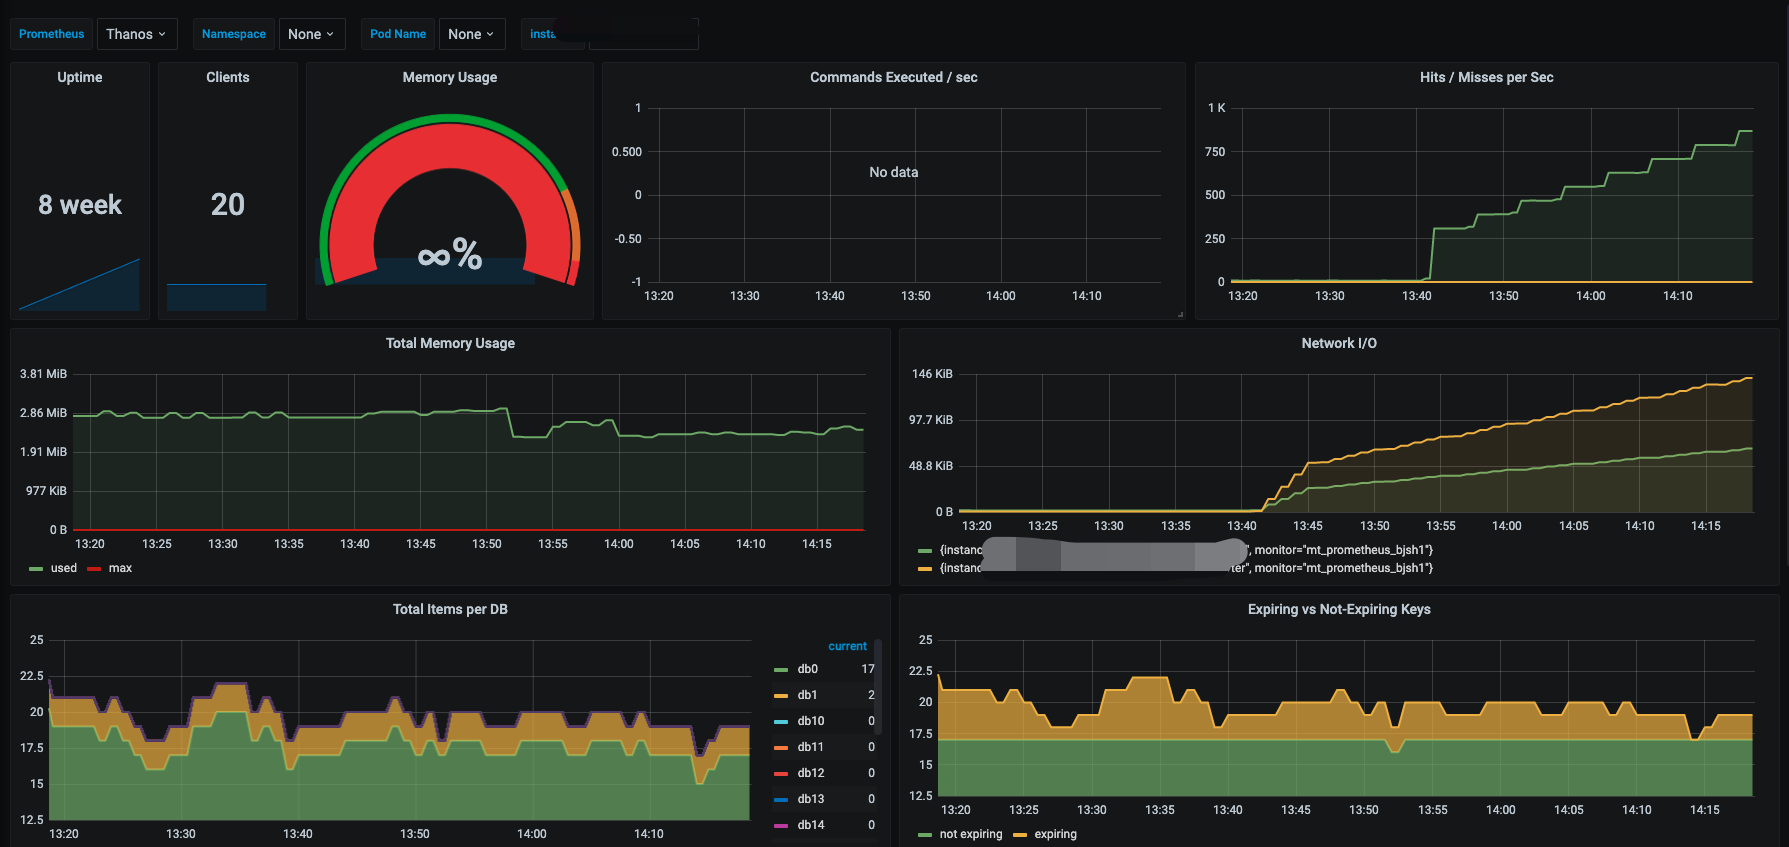
导入grafana之后,效果如下:

png1